Our CovidClue™ web app provides comparitive analysis of pandemic patterns.
To assist critical infrastructure providers, public health officials, and emergency managers, Resilient Societies developed the CovidClue™ web application available online at www.covidclue.com. COVID-19 infection and fatality data for U.S. states, counties, and metro areas are updated daily. This analytically sophisticated web app has been funded by charitable contributors to Resilient Societies and is provided to corporations, governments, and the general public as a free service.
COVID-19 Impacts on Critical Infrastructure
The COVID-19 pandemic threatens not just human health, but also the reliability and security of critical infrastructure. Well before the infections became widespread in the U.S., operators of electric grid facilities quarantined key personnel and executed other elements of their pandemic plans. For more information on how COVID-19 impacts infrastructure providers, see our paper, "Preserving Operational Continuity for Electric Utility Control Rooms During the COVID-19 Pandemic."
Finding Virus Hot Spots
CovidClue™ allows analysts to quickly identify virus hot spots in the U.S. Analysts can move backwards in time to see how infections migrated into new geographic areas.

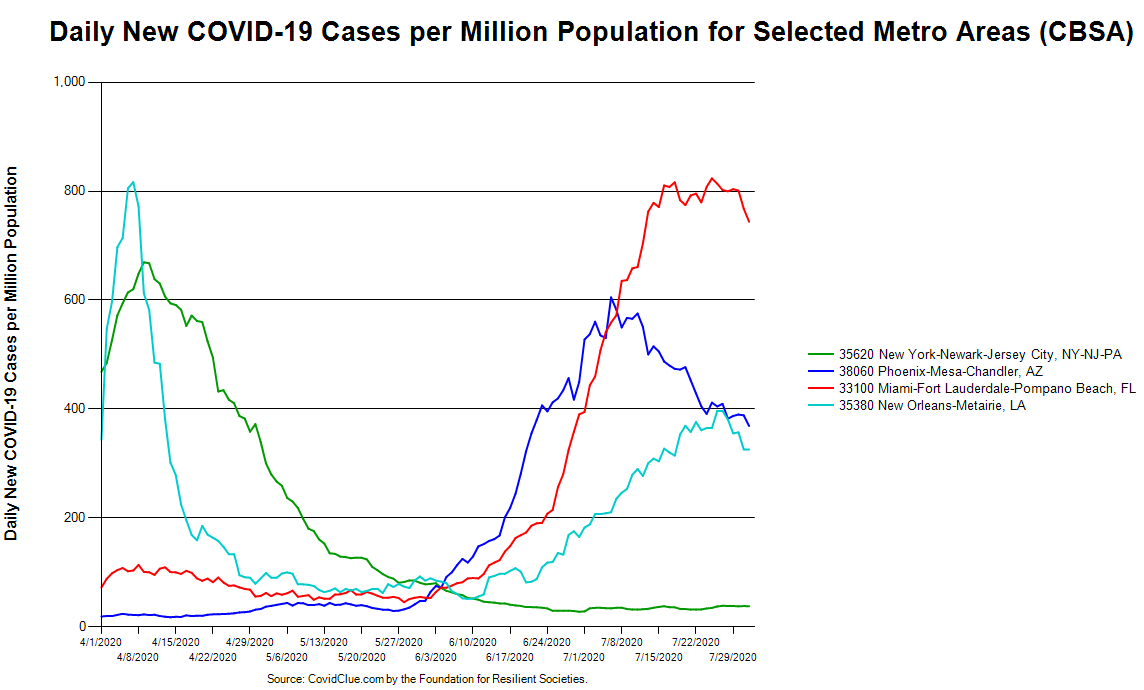
Comparing Infection and Fatality Trends
Our approach gives analysts the ability to quickly compare trends among U.S. states, counties, and metro areas. The example below shows divergent virus patterns for four major metro areas: COVID-19 cases peaked early and rapidly declined for New York city; New Orleans also peaked early but experienced a second wave. A variety of COVID-19 statistics can be graphed; time periods presented are customizable.